LIMITED TIME OFFER
Replace all of these

with a single tool for just $1 per month for your entire team
UNLIMITED USERS
UNLIMITED PROJECTS
UNLIMITED CHATS
UNLIMITED DOCS
UNLIMITED STORAGE
AND MORE..
Visual Project Planning with Interactive Gantt Charts

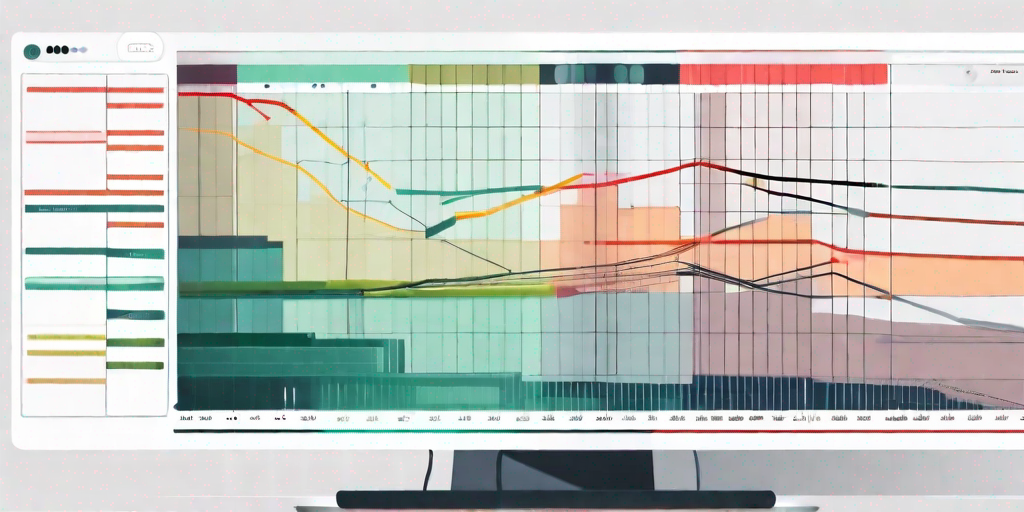
In the world of project management, a visual representation of tasks, timelines, and dependencies is essential for effective planning and execution. One popular tool that has revolutionized project planning is the Gantt chart. Gantt charts provide a visual timeline of the project, allowing stakeholders to gain a clear understanding of the project’s progress and schedule. However, traditional Gantt charts often lack the interactive features that are now available with modern technology. This article explores how interactive Gantt charts can enhance project planning and collaboration, and provides insights on implementing this powerful tool in your project management process.

Understanding the Basics of Gantt Charts
Before delving into the benefits of interactive Gantt charts, it’s important to understand the fundamentals of this project management tool. Gantt charts are bar charts that visually represent project tasks, their start and end dates, and their dependencies. They provide a comprehensive overview of the project’s timeline, milestones, and task durations. With this bird’s-eye view, project managers can effectively plan, track, and communicate progress to stakeholders.
Gantt charts have become an indispensable tool in project management due to their ability to simplify complex project schedules. By breaking down a project into smaller, manageable tasks, Gantt charts allow project managers to allocate resources, set realistic deadlines, and identify potential bottlenecks. This level of detail and organization helps teams stay on track and ensures that projects are completed on time and within budget.
Definition and Purpose of Gantt Charts
Originally developed by Henry Gantt in the early 20th century, Gantt charts were primarily used to manage manufacturing processes. However, their versatility and effectiveness soon led to their adoption in various industries to manage complex projects, such as construction, software development, and event planning. The purpose of a Gantt chart is to show the project schedule, allowing stakeholders to visualize the tasks, deadlines, and dependencies at a glance.
One of the key advantages of Gantt charts is their ability to facilitate effective project communication. By presenting project information in a clear and visually appealing format, Gantt charts enable project managers to easily communicate project plans, progress, and potential issues to team members, clients, and other stakeholders. This transparency fosters collaboration and ensures that everyone involved is on the same page, leading to smoother project execution and successful outcomes.
Key Components of Gantt Charts
A Gantt chart is made up of several key components, each playing a crucial role in visualizing the project schedule. Task bars, for example, represent individual project tasks and their durations. These bars provide a visual representation of the time required to complete each task, allowing project managers to easily identify any overlaps or gaps in the project timeline.
In addition to task bars, Gantt charts also include milestones. These milestones indicate significant points in the project’s timeline, such as the completion of a major deliverable or the start of a critical phase. By highlighting these key milestones, Gantt charts help project managers and stakeholders track progress and ensure that the project is on schedule.
Dependencies are another important component of Gantt charts. They are indicated by arrows, showing the relationships between tasks and their order of execution. Dependencies help project managers understand the sequence in which tasks need to be completed and identify any potential bottlenecks or delays. By visualizing these dependencies, Gantt charts enable project managers to make informed decisions and adjust the project schedule accordingly.
Overall, Gantt charts provide a comprehensive and intuitive way to manage project schedules. By visually representing tasks, milestones, and dependencies, they help project managers effectively plan, track, and communicate project progress. Whether it’s a small-scale project or a large-scale endeavor, Gantt charts are a valuable tool for any project manager seeking to streamline project management processes and achieve successful outcomes.
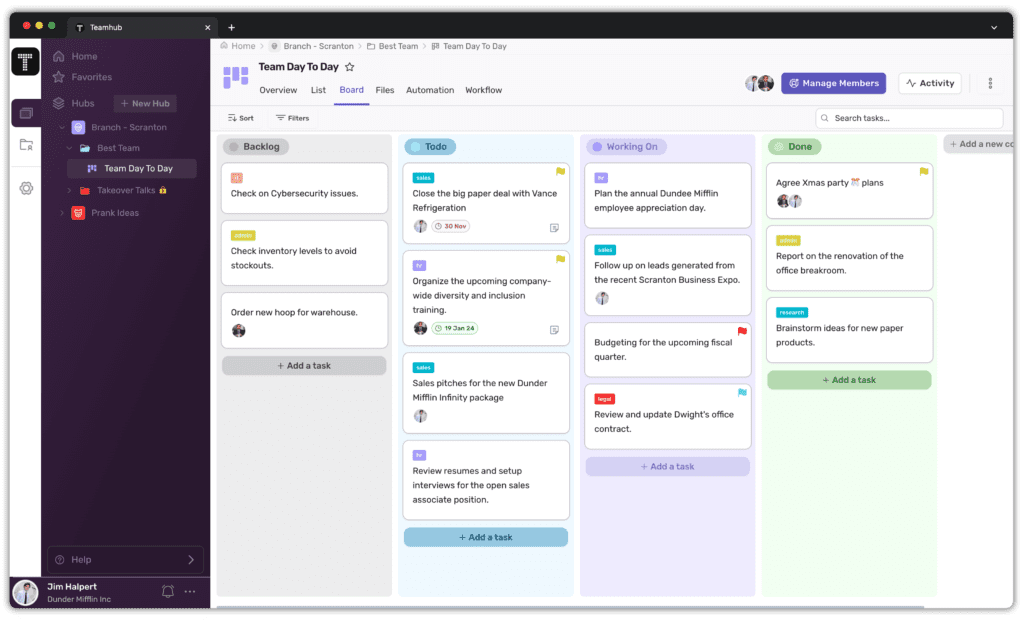
Unlock Efficiency with Teamhub

The Role of Gantt Charts in Project Planning
Gantt charts play a crucial role in project planning, aiding project managers in several ways. Let’s explore some of the key benefits that Gantt charts bring to project management.

Benefits of Using Gantt Charts in Project Management
One of the main benefits of Gantt charts is their ability to simplify complex projects. By breaking down the project into tasks and assigning them to specific timelines, project managers can easily identify areas that need attention and allocate resources accordingly.
Gantt charts also allow for better time management by visualizing project dependencies, helping teams to meet deadlines and deliver projects on schedule. By clearly outlining the sequence of tasks and their interdependencies, project managers can identify critical paths and potential bottlenecks, enabling them to make informed decisions and adjust timelines as needed.
Furthermore, Gantt charts facilitate effective communication between team members and stakeholders. With a visual representation of the project’s timeline and progress, everyone involved can easily understand the current status of the project and make informed decisions.
Project managers can use Gantt charts to communicate project milestones, deadlines, and deliverables to team members, ensuring that everyone is on the same page and working towards the same goals. This helps to improve coordination and collaboration within the team, leading to increased productivity and project success.
How Gantt Charts Facilitate Team Collaboration
Interactive Gantt charts take collaboration to a whole new level. With the rise of cloud-based project management tools, teams can now work together in real-time on a single Gantt chart. This means that everyone involved has access to the most up-to-date information about task assignments, progress updates, and any changes made to the project.
Collaborative Gantt charts allow team members to communicate and collaborate seamlessly, regardless of their location or time zone. They can leave comments, ask questions, and provide updates directly on the Gantt chart, eliminating the need for lengthy email threads or time-consuming meetings.
This level of transparency and collaboration helps to improve teamwork, productivity, and overall project success. Team members can easily see who is responsible for each task, track progress, and identify any potential roadblocks or resource constraints. This enables them to work together more efficiently, resolve issues in a timely manner, and deliver high-quality results.
Moreover, collaborative Gantt charts foster a sense of ownership and accountability among team members. When everyone can see the progress and contributions of their colleagues, it encourages a culture of collaboration and motivates individuals to perform at their best.
In conclusion, Gantt charts are an invaluable tool in project planning and management. They simplify complex projects, improve time management, facilitate effective communication, and enhance team collaboration. By leveraging the power of Gantt charts, project managers can streamline their processes, optimize resource allocation, and ensure the successful delivery of projects.
Transitioning from Traditional to Interactive Gantt Charts
While traditional Gantt charts have been widely used for decades, interactive Gantt charts offer a range of additional benefits for modern project management. Let’s explore some of the main differences between traditional and interactive Gantt charts, as well as the advantages of making the switch.
Differences between Traditional and Interactive Gantt Charts
Traditional Gantt charts are often created using tools like Microsoft Excel or similar software, requiring manual updates and limited collaboration capabilities. On the other hand, interactive Gantt charts are web-based and offer real-time collaboration, allowing everyone involved to access and contribute to the project’s timeline simultaneously. Furthermore, interactive Gantt charts often provide additional features such as drag-and-drop functionality and integration with other project management tools.
The Evolution of Gantt Charts in the Digital Age
Interactive Gantt charts have evolved along with advancements in technology. They now offer seamless integration with other project management tools such as task management software, resource allocation platforms, and communication tools. This integration streamlines the project management process, enabling teams to work more efficiently and effectively.
Features of Interactive Gantt Charts
Interactive Gantt charts include various features that enhance project planning and collaboration. Let’s explore some of the key features that make interactive Gantt charts an invaluable tool for project managers.

Drag-and-Drop Functionality
Interactive Gantt charts allow project managers to easily modify task durations, dependencies, and resource assignments by simply dragging and dropping elements on the chart. This flexibility enables quick adjustments to the project timeline, accommodating changes and mitigating risks with ease.
Real-Time Updates and Notifications
With interactive Gantt charts, real-time updates and notifications keep everyone informed about any changes made to the project. This ensures that team members are always working with the most current information, reducing the risk of miscommunication and enabling timely decision-making.
Integration with Other Project Management Tools
Interactive Gantt charts often integrate seamlessly with other essential project management tools, such as task management software and resource allocation platforms. This integration eliminates the need for manual data entry and enables smooth collaboration across different project management platforms.
Implementing Interactive Gantt Charts in Your Project Planning
Now that you understand the benefits of interactive Gantt charts, let’s explore how to implement this powerful tool in your project planning process.
Choosing the Right Gantt Chart Software
When selecting Gantt chart software, consider features such as ease of use, collaboration capabilities, and integration options. Look for platforms that offer a user-friendly interface, as well as the ability to customize the chart based on your project’s unique requirements. It’s also important to choose software that aligns with your team’s preferred project management methodology.
Best Practices for Using Interactive Gantt Charts
To make the most of interactive Gantt charts, follow these best practices:
- Break down your project into smaller tasks to enhance clarity and accuracy
- Set realistic deadlines and allocate resources accordingly
- Regularly update the Gantt chart with progress, delays, and changes in dependencies
- Ensure that team members have access to the Gantt chart and understand how to use it effectively
- Communicate any changes or updates to stakeholders in a timely manner
By following these best practices, you can leverage the power of interactive Gantt charts to streamline your project planning process and improve project outcomes.
In conclusion, interactive Gantt charts offer significant advantages over traditional Gantt charts in terms of collaboration, real-time updates, and integration with other project management tools. With their intuitive interfaces and powerful features, they empower project managers to effectively plan, track, and execute projects. By embracing interactive Gantt charts, you can enhance visual project planning and take your project management process to the next level.


