
Real-time visualization has become an integral part of project management in recent years. It allows project managers to track progress, identify bottlenecks, and make data-driven decisions in a timely manner. Understanding the concept of real-time visualization is crucial for project success.
Understanding the Concept of Real-Time Visualization
Real-time visualization refers to the ability to display project data and metrics in a visually appealing and interactive manner. It provides stakeholders with up-to-date information on project progress, allowing them to monitor key performance indicators (KPIs) in real-time.

Real-time visualization is a powerful tool that revolutionizes the way project management is conducted. By presenting data in a dynamic and engaging format, it enhances decision-making processes and facilitates collaboration among team members.
With real-time visualization, project managers can quickly identify bottlenecks, track resource allocation, and assess project risks. This enables them to make informed decisions and take proactive measures to ensure project success.
The Importance of Real-Time Data in Project Management
In project management, having access to real-time data is vital for effective decision-making. Real-time data enables project managers to identify issues, spot trends, and take corrective actions promptly. It takes project transparency and accountability to a whole new level, ensuring everyone is on the same page.
Real-time data provides project managers with a comprehensive and accurate view of project performance. By monitoring KPIs in real-time, they can gauge the project’s progress against predefined goals and objectives. This allows them to make timely adjustments and optimize project outcomes.
Furthermore, real-time data empowers project managers to proactively manage risks. By continuously monitoring project metrics, they can identify potential issues before they escalate, enabling them to mitigate risks and keep the project on track.
Key Components of Real-Time Visualization
A successful real-time visualization system should consist of several key components. First and foremost, it requires robust data collection and integration mechanisms to gather project-related data from various sources. This data is then processed and visualized using appropriate tools and techniques.
Efficient data collection is crucial for real-time visualization. It involves capturing data from multiple sources, such as project management software, sensors, and other relevant systems. This data is then consolidated and transformed into meaningful insights that can be easily understood and interpreted.
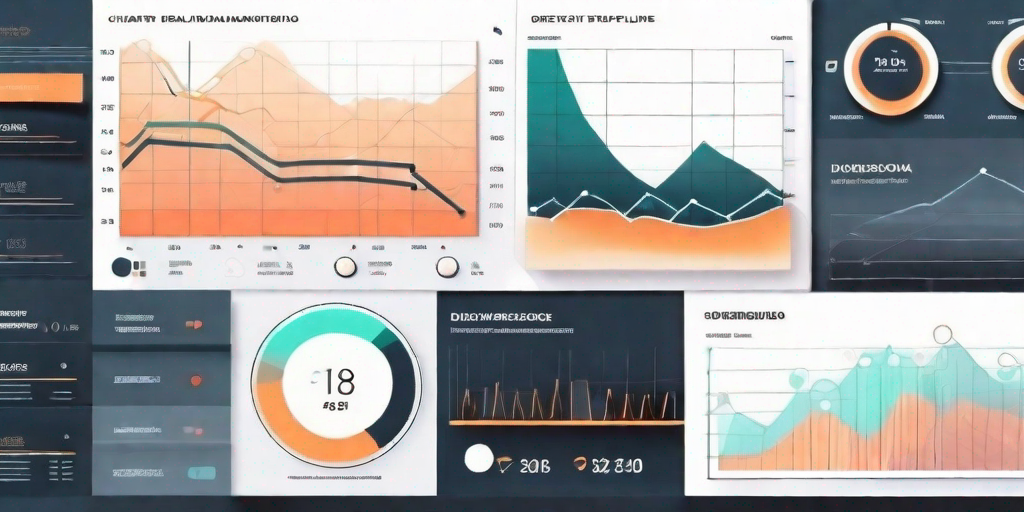
Secondly, real-time visualization should have a user-friendly interface that allows stakeholders to navigate through the data effortlessly. Intuitive dashboards, charts, and graphs make it easier to interpret project information and identify areas for improvement.
Visual representations play a vital role in real-time visualization. They enable stakeholders to grasp complex project data at a glance, facilitating quick decision-making. Interactive charts and graphs allow users to drill down into specific details, providing a deeper understanding of project performance.
Additionally, real-time visualization should support collaboration and communication among project team members. It should allow for real-time updates and notifications, ensuring that everyone is aware of the latest project developments. This fosters a collaborative environment and promotes effective teamwork.
In conclusion, real-time visualization is a game-changer in project management. It empowers project managers with actionable insights, enhances decision-making, and promotes collaboration. By harnessing the power of real-time data, organizations can drive project success and achieve their strategic objectives.
The Role of Real-Time Visualization in Project Management
Real-time visualization plays a pivotal role in project management by enhancing decision-making processes and improving team collaboration and communication.
Project management is a complex process that requires careful planning, coordination, and execution. Without proper tools and techniques, it can be challenging for project managers to keep track of all the moving parts and make informed decisions. This is where real-time visualization comes into play.
Enhancing Decision-Making Processes
With real-time visualization, project managers can make informed decisions based on accurate and timely data. They can quickly recognize potential risks, monitor resource allocation, and adjust project plans accordingly. This agility in decision-making helps minimize delays and ensures project success.
Imagine a scenario where a project manager is overseeing the construction of a new office building. By using real-time visualization tools, they can monitor the progress of different construction activities, such as foundation laying, structural framework, and interior design. If they notice any delays or issues, they can quickly identify the root cause and take corrective actions. For example, if there is a delay in the delivery of construction materials, the project manager can immediately contact the supplier and arrange for an alternative solution. This proactive approach ensures that the project stays on track and meets its deadlines.
Improving Team Collaboration and Communication
Real-time visualization fosters transparency and collaboration within project teams. By sharing real-time project information, team members can align their efforts, identify dependencies, and work towards common goals. It facilitates effective communication and encourages proactive problem-solving.
Consider a software development project where multiple teams are working on different modules. With real-time visualization, each team can see the progress of other teams, identify potential bottlenecks, and collaborate to resolve them. For instance, if the frontend team is experiencing difficulties in integrating their code with the backend system, they can immediately reach out to the backend team for assistance. This seamless collaboration ensures that the project progresses smoothly and reduces the chances of rework or delays.
Furthermore, real-time visualization also enables project managers to communicate project updates and milestones to stakeholders effectively. They can generate visual reports and dashboards that provide a comprehensive overview of the project’s status, including key metrics, risks, and achievements. This transparency builds trust among stakeholders and allows them to make informed decisions regarding the project.
Tools and Techniques for Real-Time Visualization
A wide range of tools and techniques are available to enable real-time visualization in project management. These tools and techniques play a crucial role in enhancing project communication, improving decision-making, and ensuring project success.
Real-time visualization allows project managers and stakeholders to gain a comprehensive understanding of project progress, identify potential bottlenecks, and make informed decisions promptly. By providing a visual representation of project data, real-time visualization tools and techniques enable stakeholders to quickly grasp project status at a glance.
Overview of Popular Visualization Tools
Popular visualization tools include Gantt charts, Kanban boards, and project management software with built-in dashboards. These tools provide a visual representation of project tasks, timelines, and dependencies, enabling stakeholders to easily track progress and identify any potential delays or issues.

Gantt charts, for example, offer a timeline view of project tasks, showing their start and end dates, as well as their dependencies. This visualization technique allows project managers to identify critical paths, allocate resources efficiently, and adjust project schedules as needed.
Kanban boards, on the other hand, provide a visual representation of project tasks in columns, such as “To Do,” “In Progress,” and “Completed.” This technique allows project teams to track the status of each task, identify bottlenecks, and optimize workflow.
Project management software with built-in dashboards combines various visualization techniques to provide a comprehensive overview of project data. These dashboards often include charts, graphs, and other visual elements to present project metrics, key performance indicators (KPIs), and other relevant information.
Selecting the Right Visualization Technique
Choosing the appropriate visualization technique depends on the nature of the project, the type of data to be visualized, and the target audience. Different techniques, such as heat maps, scatter plots, and network diagrams, can be employed to highlight specific aspects of the project and convey insights effectively.
Heat maps, for instance, are useful for visualizing data patterns and trends. They use color gradients to represent the intensity or density of data points, allowing project managers to identify areas of high or low activity.
Scatter plots, on the other hand, are effective for visualizing relationships between two variables. By plotting data points on a graph, project managers can identify correlations, outliers, and other patterns that may impact project outcomes.
Network diagrams are particularly useful for visualizing complex relationships and dependencies. They use nodes and edges to represent project components and their connections, providing a clear visual representation of the project’s structure.
Ultimately, the choice of visualization technique should align with the project’s objectives and the information that needs to be conveyed. By selecting the right visualization technique, project managers can enhance project understanding, facilitate effective communication, and drive successful project outcomes.
Challenges and Solutions in Implementing Real-Time Visualization
Implementing real-time visualization in project management comes with its own set of challenges. However, with the right strategies, these challenges can be overcome.
Common Obstacles in Real-Time Visualization
One common challenge is collecting and integrating data from disparate systems and tools. Different teams may use different software, making data consolidation a complex task. Additionally, managing data security and privacy concerns can be challenging when sharing real-time project information.
Effective Strategies to Overcome Challenges
To address these challenges, organizations can invest in centralized project management tools that offer built-in visualization capabilities. This creates a single source of truth for project data, simplifying data collection and integration. Implementing robust data governance practices and ensuring data security protocols are in place can help alleviate concerns regarding information sharing.
The Future of Real-Time Visualization in Project Management
The field of real-time visualization is constantly evolving, driven by advancements in technology and industry trends.
Emerging Trends in Visualization Technology
Artificial intelligence (AI) and machine learning are revolutionizing real-time visualization by automating data analysis and providing predictive insights. With AI-powered algorithms, project managers can gain valuable foresight into project performance and take proactive measures to mitigate risks.
The Impact of AI and Machine Learning on Real-Time Visualization
AI and machine learning algorithms can process and analyze vast amounts of project data in real-time. This enables project managers to identify patterns, detect anomalies, and make data-driven decisions swiftly. Their integration with real-time visualization tools will further enhance project management practices and drive project success.
In conclusion, real-time visualization is a powerful tool that can transform project management. By understanding its concept, leveraging the right tools and techniques, overcoming challenges, and embracing emerging trends, organizations can streamline project progress monitoring and drive efficiency and effectiveness in their project management endeavors.