
Effective project management is crucial to success. One tool that has revolutionized project planning and tracking is the Gantt chart. In this article, we will explore how to create professional Gantt charts using a powerful visualizer. With this tool, you can easily visualize project timelines, track progress, and manage resources efficiently.

Understanding the Basics of Gantt Charts
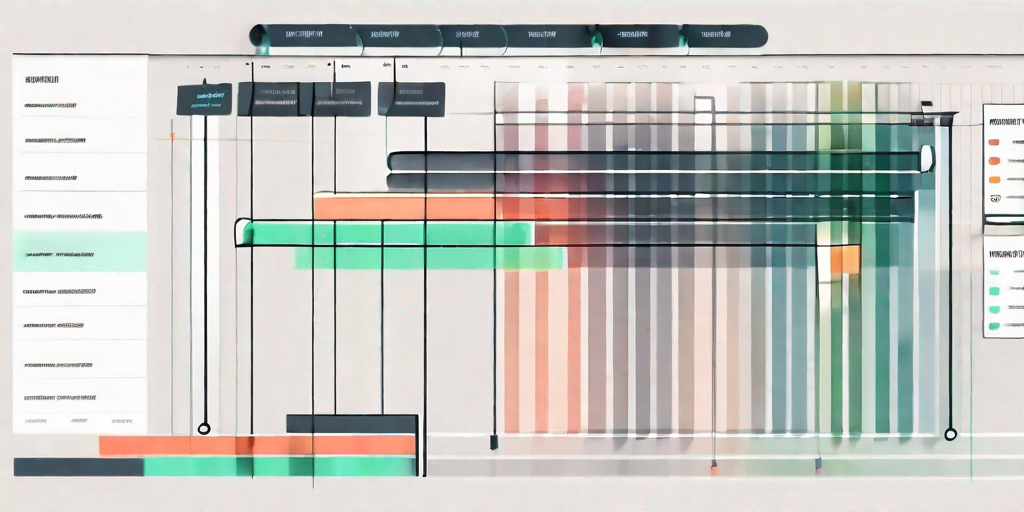
A Gantt chart is a visual representation of a project schedule. It displays tasks as horizontal bars along a timeline, showing their start and end dates. Gantt charts provide a clear overview of project milestones, dependencies, and the critical path. They are widely used in project management to plan, schedule, and track progress.
Gantt charts are especially valuable for complex projects with multiple tasks and dependencies. By visualizing the project timeline, teams can understand the order of tasks and identify potential bottlenecks or delays. This helps in resource allocation, task prioritization, and risk management.
Let’s dive deeper into the world of Gantt charts and explore their key components and benefits.
What is a Gantt Chart?
A Gantt chart is a visual tool that shows project tasks, their durations, and dependencies on a timeline. Each task is represented as a horizontal bar, where the length of the bar represents the task’s duration. The starting point of the bar indicates the task’s start date, and the endpoint represents its end date.
In addition to task bars, Gantt charts often include milestones, which are significant points in the project that mark key achievements or events. Milestones are represented as diamond-shaped markers along the timeline.
Now, let’s take a closer look at the elements that make up a Gantt chart.
The Importance of Gantt Charts in Project Management
Gantt charts play a crucial role in project management for several reasons. Firstly, they provide a visual representation of the project schedule, making it easier for teams to understand and communicate the project plan. This promotes collaboration and alignment among team members.
Secondly, Gantt charts enable project managers to track progress and identify any deviations from the planned timeline. By comparing the actual progress with the scheduled timeline, project managers can take proactive measures to address delays or adjust resources as needed.
Furthermore, Gantt charts help in resource allocation. By visualizing the tasks and their durations, project managers can allocate resources efficiently, ensuring that each task has the necessary resources to be completed on time.
Additionally, Gantt charts aid in task prioritization. With a clear overview of the project timeline, project managers can identify critical tasks and prioritize them accordingly. This ensures that the most important tasks are completed first, reducing the risk of project delays.
Moreover, Gantt charts assist in risk management. By visualizing the dependencies between tasks, project managers can identify potential bottlenecks or areas of high risk. This allows them to develop contingency plans and mitigate potential issues before they impact the project’s timeline.
In conclusion, Gantt charts are a powerful tool in project management. They provide a visual representation of the project schedule, enabling teams to understand, plan, and track progress effectively. By utilizing Gantt charts, project managers can optimize resource allocation, prioritize tasks, and mitigate risks, ultimately leading to successful project completion.
Introduction to Visualizer for Gantt Charts
Visualizer is a powerful tool that simplifies the process of creating professional Gantt charts. With its user-friendly interface and robust features, it allows project managers and teams to create, customize, and analyze Gantt charts effortlessly.

When it comes to project management, Gantt charts are an essential tool for visualizing project schedules and tracking progress. They provide a clear and organized representation of tasks, timelines, and dependencies. However, creating and managing Gantt charts manually can be time-consuming and prone to errors. This is where Visualizer comes in.
Visualizer offers a wide range of features that enhance the functionality and usability of Gantt charts. Some of its key features include:
- Drag-and-drop interface for easy task creation and scheduling.
- Dependency management to define task relationships and dependencies.
- Resource allocation and management to assign tasks to team members.
- Real-time collaboration for seamless communication and teamwork.
Drag-and-drop interface
With the drag-and-drop interface, creating and scheduling tasks becomes a breeze. Project managers can simply drag tasks onto the chart and adjust their durations and start dates with ease. This saves valuable time and eliminates the need for manual data entry.
Dependency management
Dependency management is another powerful feature of Visualizer. Project managers can easily define task relationships and dependencies, ensuring that tasks are executed in the correct order. This helps prevent bottlenecks and delays, ultimately leading to a more efficient project timeline.
Resource allocation
Resource allocation and management is crucial for effective project planning. With Visualizer, project managers can easily assign tasks to team members and track their progress. This ensures that work is evenly distributed and that everyone is aware of their responsibilities.
Real-time collaboration
Real-time collaboration is a game-changer for project teams. With Visualizer, team members can access and update Gantt charts in real-time, no matter where they are located. This promotes seamless communication and teamwork, as everyone is on the same page and can contribute to the project’s success.
Benefits of Using Visualizer for Gantt Charts
Using Visualizer for Gantt charts brings numerous benefits to project teams. Firstly, it saves time and effort in creating and updating Gantt charts manually. With Visualizer’s automated features, project managers can focus on other critical aspects of project management.
Secondly, Visualizer provides a centralized platform for collaboration and data sharing. Team members can access and update Gantt charts in real-time, ensuring everyone is aligned and up to date. This promotes transparency and fosters effective communication within the team.
Furthermore, Visualizer’s robust features enable project managers to analyze Gantt charts and gain valuable insights. They can easily identify critical paths, resource bottlenecks, and potential risks. This empowers project managers to make informed decisions and take proactive measures to keep the project on track.
In conclusion, Visualizer is a comprehensive tool that simplifies the creation and management of Gantt charts. Its user-friendly interface, powerful features, and collaborative capabilities make it an invaluable asset for project teams. By using Visualizer, project managers can streamline their workflow, enhance communication, and ultimately achieve project success.
Step-by-Step Guide to Creating Gantt Charts with Visualizer
Creating Gantt charts with Visualizer is a straightforward process. Let’s walk through the steps:
Setting Up Your Visualizer
Begin by logging into Visualizer and creating a new project. Set your project start date and define the project scope. This will serve as the foundation for your Gantt chart.
When setting up your Visualizer project, it is important to consider the overall timeline and goals of your project. By defining the project start date, you establish a reference point for all the tasks and milestones that will be included in your Gantt chart. The project scope, on the other hand, helps you determine the boundaries and deliverables of your project, ensuring that you have a clear understanding of what needs to be accomplished.
By taking the time to carefully set up your Visualizer project, you are laying the groundwork for a well-organized and effective Gantt chart.
Inputting Your Project Data
Once your project is set up, start inputting your project data into Visualizer. This includes creating tasks, setting their durations, and defining dependencies. Visualizer’s drag-and-drop interface makes it easy to arrange tasks and adjust their timelines.
When inputting your project data, it is important to break down your project into smaller, manageable tasks. This allows you to have a clear overview of the work that needs to be done and helps you identify any dependencies between tasks. By setting the durations for each task, you can estimate the time required to complete them and allocate resources accordingly.
Defining dependencies is crucial for creating an accurate Gantt chart. By specifying the relationships between tasks, Visualizer can automatically adjust the timeline based on changes in task durations or dependencies. This ensures that your Gantt chart reflects the most up-to-date information and helps you stay on track with your project.
Customizing Your Gantt Chart
Visualizer allows you to customize your Gantt chart to suit your project’s needs. You can choose different colors or styles for task bars, milestones, and dependencies. Additionally, you can add labels, notes, or attachments to provide additional context or instructions to team members.
Customizing your Gantt chart not only adds visual appeal but also enhances its functionality. By using different colors or styles for task bars, you can differentiate between different types of tasks or highlight important milestones. This makes it easier for team members to understand the progress and priorities of the project at a glance.
Adding labels, notes, or attachments to your Gantt chart can provide valuable information and instructions to team members. This ensures that everyone involved in the project has access to the necessary details and can stay informed about any specific requirements or updates.
With Visualizer’s customization options, you can create a Gantt chart that not only effectively communicates your project plan but also captures the unique characteristics and requirements of your project.
Tips for Creating Effective Gantt Charts
While using Visualizer simplifies the process, there are certain best practices to keep in mind when creating Gantt charts:
Choosing the Right Level of Detail
Striking the right balance between too much and too little detail is essential. Include enough detail to ensure clarity and understanding, but avoid overwhelming the audience with unnecessary information. Focus on the critical tasks and milestones that drive the project forward.
Using Colors and Symbols Effectively
Colors and symbols can make your Gantt chart visually appealing and easy to comprehend. Use colors to differentiate task categories or indicate task status (e.g., completed, in progress, not started). Similarly, use symbols, like diamonds for milestones, to draw attention to significant project events.
Troubleshooting Common Issues with Visualizer
While Visualizer is a robust tool, users may encounter certain challenges or issues during their Gantt chart creation process. Let’s address some common problems and their solutions:
Dealing with Overlapping Tasks
If you have tasks that overlap or have conflicting timelines, you can adjust the task durations or dependencies in Visualizer. Alternatively, consider reorganizing tasks or allocating additional resources to resolve the conflicts.
Adjusting Time Scales
If your Gantt chart covers a long duration, you may need to adjust the time scale to accommodate the project’s timeline effectively. Visualizer allows you to zoom in or out on the timeline, ensuring clarity and readability.
In conclusion, using Visualizer for creating professional Gantt charts empowers project teams to efficiently plan, track, and manage their projects. With its intuitive interface, powerful features, and collaborative capabilities, Visualizer simplifies project management, promotes teamwork, and enhances project visibility. Incorporating Gantt charts into your project management toolkit brings significant advantages in terms of efficiency, communication, and timely project completion. Start using Visualizer today and elevate your project management practices to new heights!